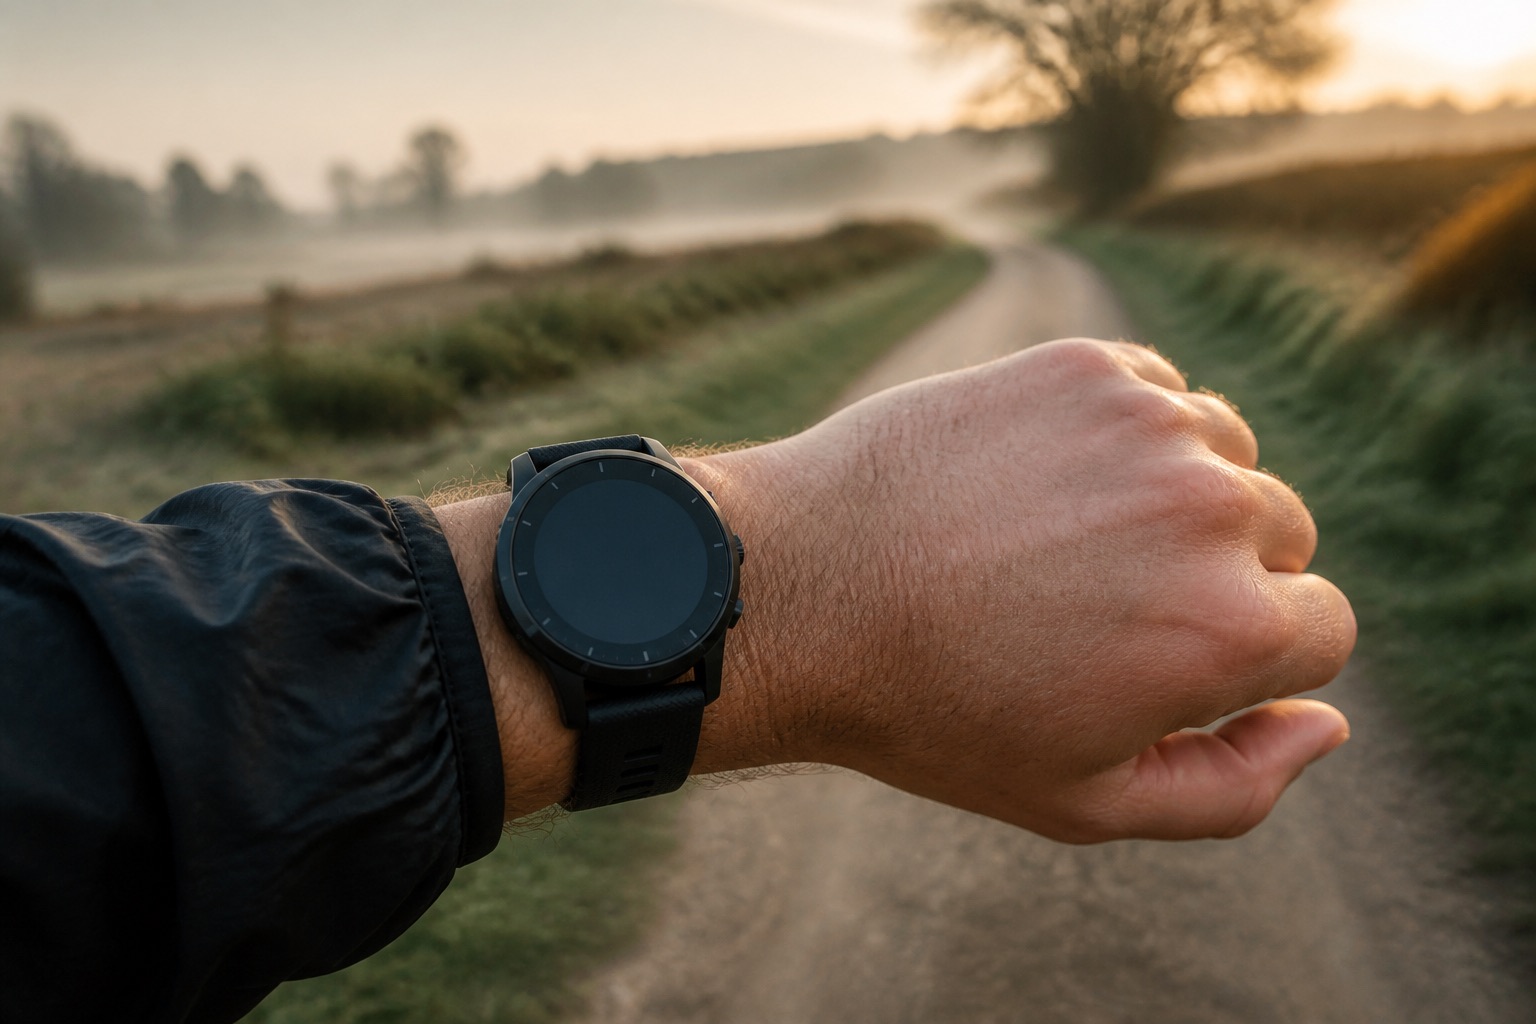
I love the watch. I still cannot see my running.
I love Garmin watches. Properly love them. A Forerunner first. Then a Fitbit for a while, which was fine until it was not. Then a Fenix 5, when the holy grail appeared: music from the watch, phone left at home. Then a Fenix 7, which is still on my wrist. I like a watch. That is not a secret if you have seen my arm.
When they go wrong, Garmin support has been good. I will moan about Connect all day. I will not pretend the company vanishes when a charging port dies or the GPS has a sulk. They have sorted it. That is part of why I stay.
The wrist is not the problem.
Connect is. I open it, click a year, click a month, click an activity, and by the time I have found the chart I wanted I have forgotten why I opened the laptop. The phone app is alright for yesterday. It is not alright for nineteen years of files sitting in a cupboard Garmin built and then refused to show me properly.
I like some of Strava. The map. Other people, occasionally. Segments, if I am in that mood. It is nicer to look at than Connect. It still will not put the whole story on one screen. Heart rate in one place, kilometres in another, shoes in a third, and me with a spreadsheet open because I cannot help myself.
I should confess that now. I love a spreadsheet. Columns, filters, a slightly ugly chart I made at half ten at night. A lot of this started there. Garmin would not show me pace at a heart rate over a decade, so I exported the lot and poked it in rows until it resembled a life.
I have done this before, in other shapes. Grandad Solitaire because a card game should not need an account. Alcohol Units because a drinks tally should stay on the phone. A target-time check because I cannot leave a number alone. Same habit. Make the small thing I actually wanted.
This one is a Mac app. Garmin Insights, for now. It reads the export Garmin already lets you download. The files stay on this computer. Nothing is uploaded. It is not a product. It is a work in progress, and I keep changing it, which is how I know it is mine.
The front page
The first screen is last 28 days against the 90 days before that. Weekly distance, sessions, pace at 140 bpm, VO2, resting heart rate, HRV, sleep, body battery, weight, cadence, ground contact. Each card says whether the number moved, and which way.
I do not need Garmin to tell me my VO2 is 51. I need to know if it is drifting. If sleep went up while HRV went down. If I am walking more than I think, which I usually am.
Underneath is the long pile. 6,676 sessions. 28,174 km. July 2007 to last week. A bar for running, a bar for walking, and a monthly distance line that does not care what year the marketing team is in.
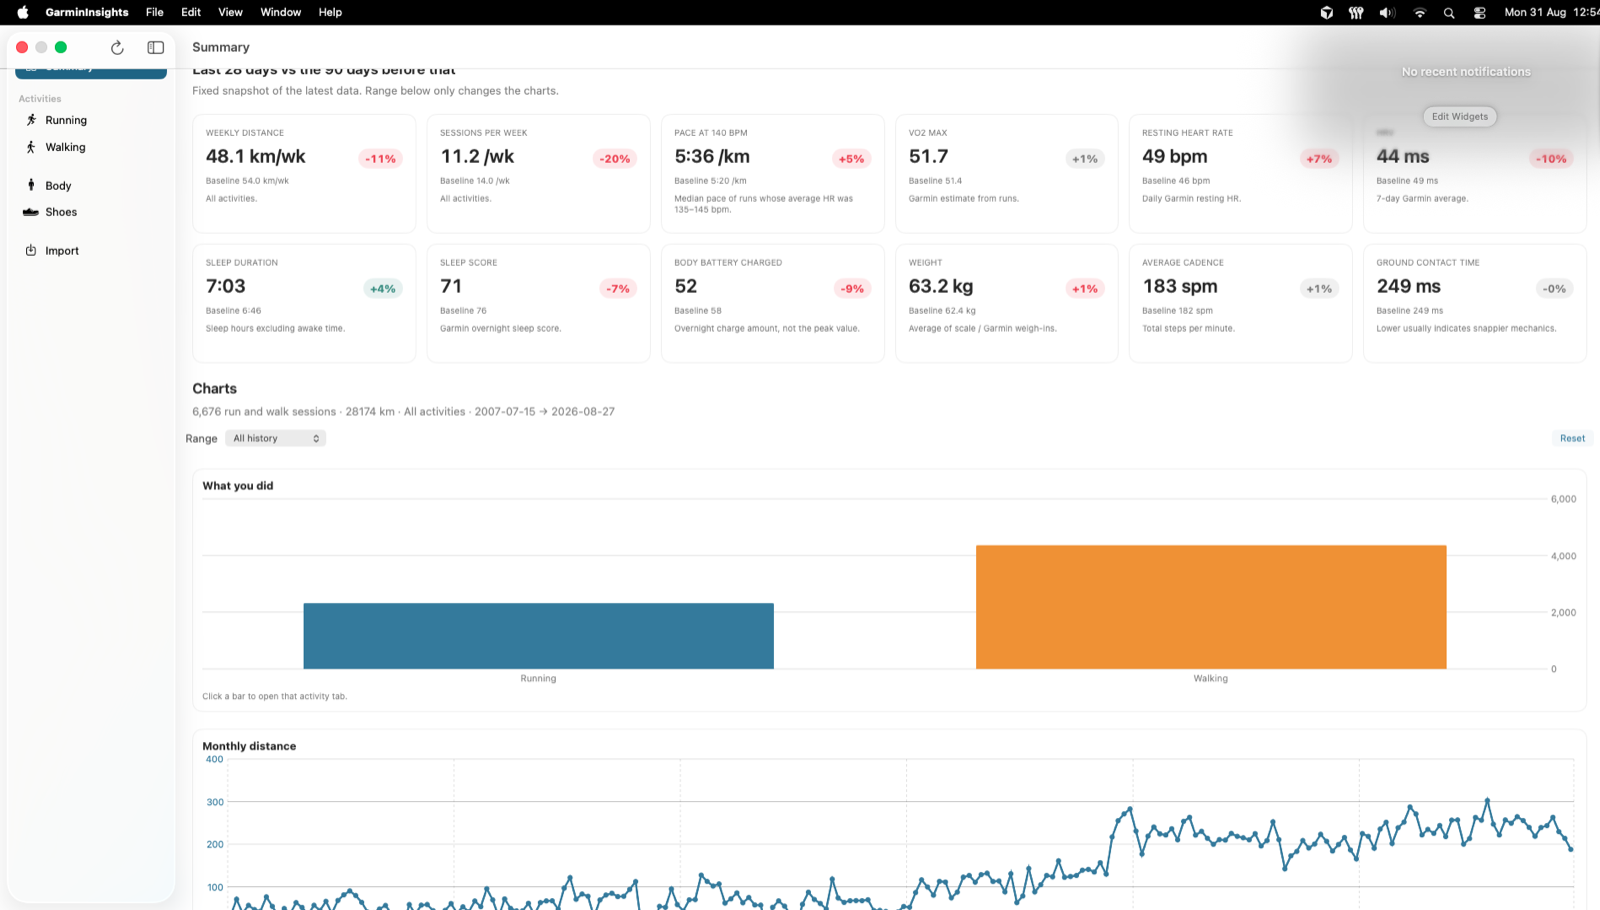
If I only had this, I would already close Connect more often.
Running, all of it
Open Running, set the range to all history, and try not to make a noise.
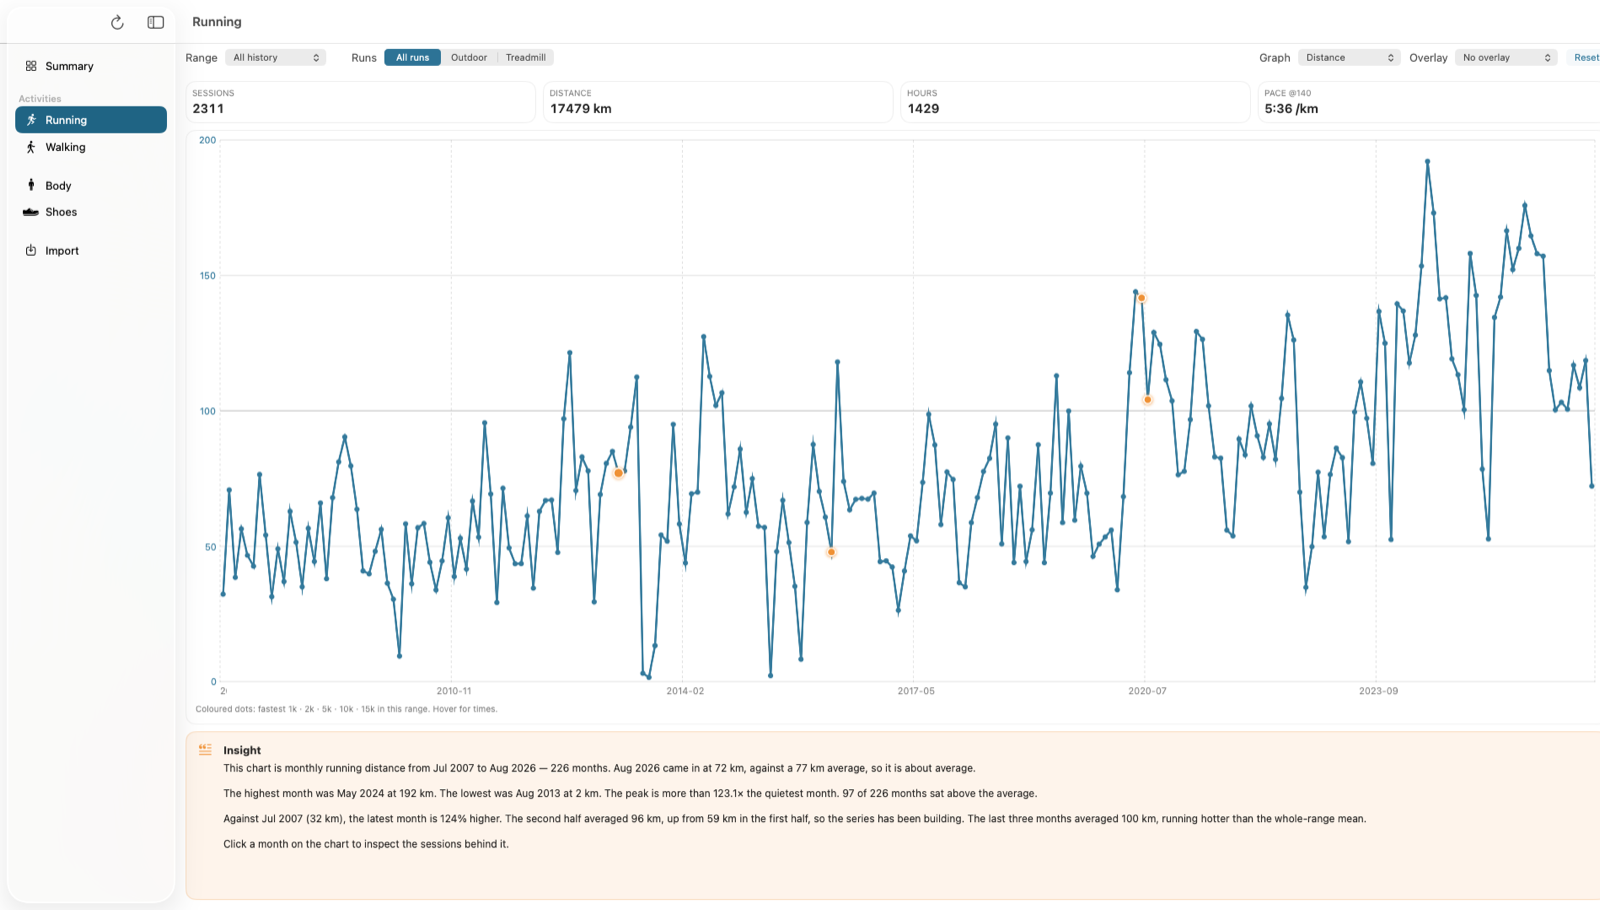
2,311 runs. 17,479 km. 1,429 hours. Pace at 140 bpm on the right, because that number means more to me than a 5K I happened to race on a Saturday I have already forgotten.
The graph is monthly distance from 2007. The coloured dots are the fastest 1k, 2k, 5k, 10k and 15k in whatever range you have picked. Hover for the times. Click a month and the sessions behind it come up, which is the bit I used to do by scrolling a spreadsheet until my eyes went.
There is a paragraph under the chart. Not a coach. A note I asked the app to write so I would not have to squint. This month against the average. The fattest month. The thinnest. Whether the second half of the history is heavier than the first.
Connect will show you August. Strava will show you this week. Neither of them will tell you, in one breath, that the second half of the archive averaged 96 km a month and the first half averaged 59.
Two things at once
You can put another line on the same chart, which is the whole point of having left the website.
Last two years, distance as bars, heart rate over the top. The note underneath said something I had felt and never quite measured: when monthly running distance rose, heart rate tended to fall.
That is not magic. It is just the two numbers Garmin already had, sitting in the same window instead of two reports I was meant to remember.
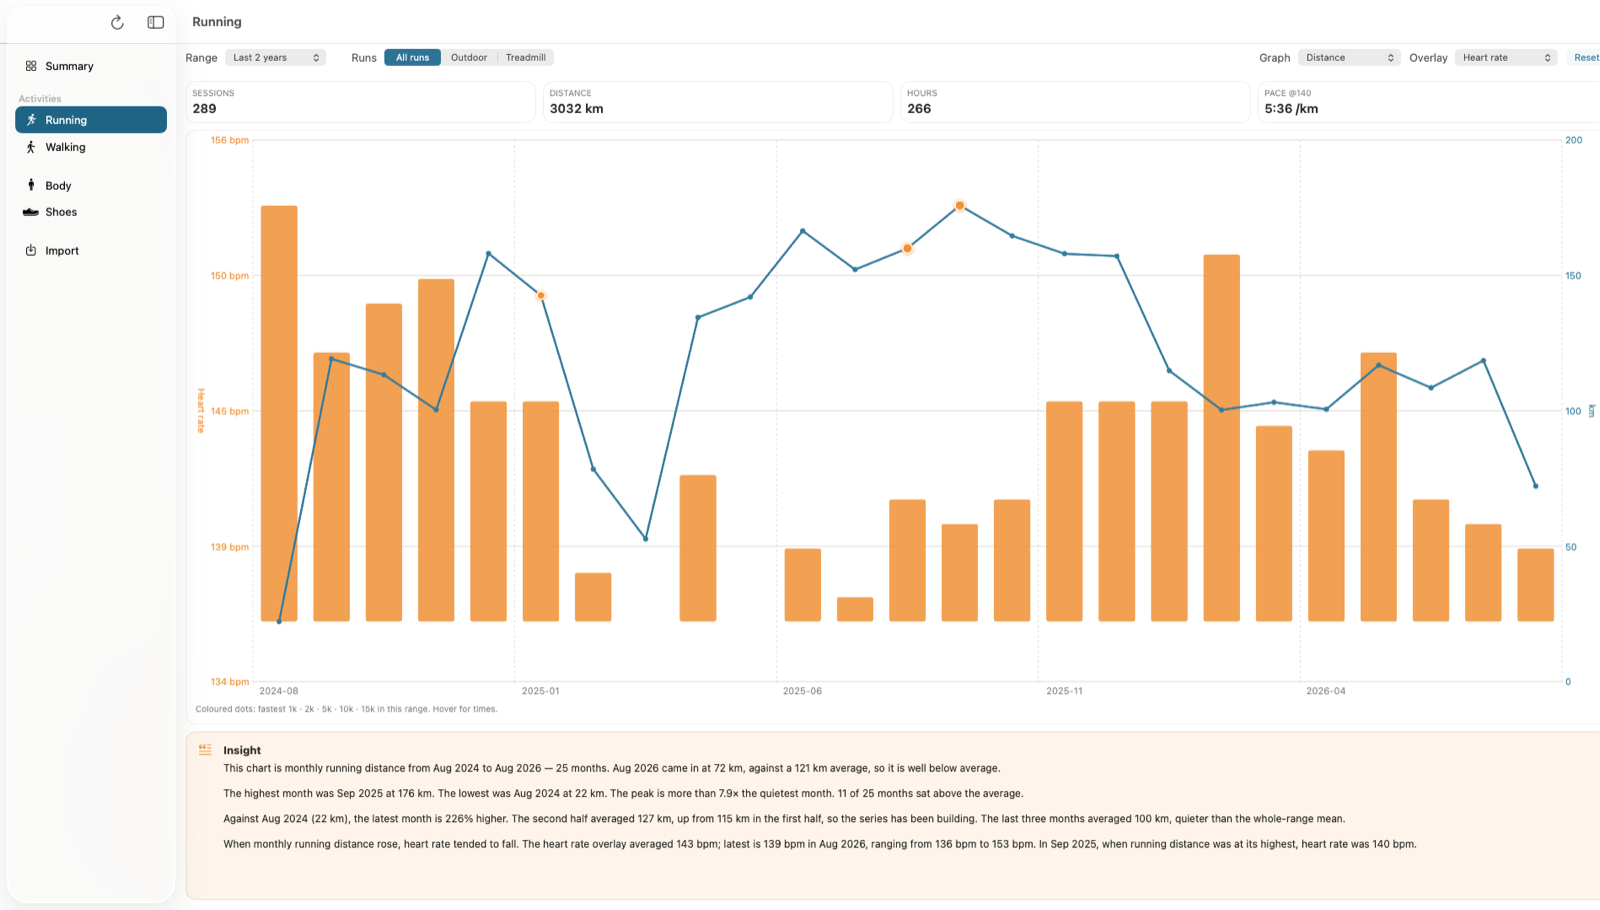
You can switch outdoor and treadmill. You can pick a year. The graph can be distance, time, elevation, cadence, whatever actually came in the zip. I keep adding options. Some of them will probably move next week.
Pace at a heart rate
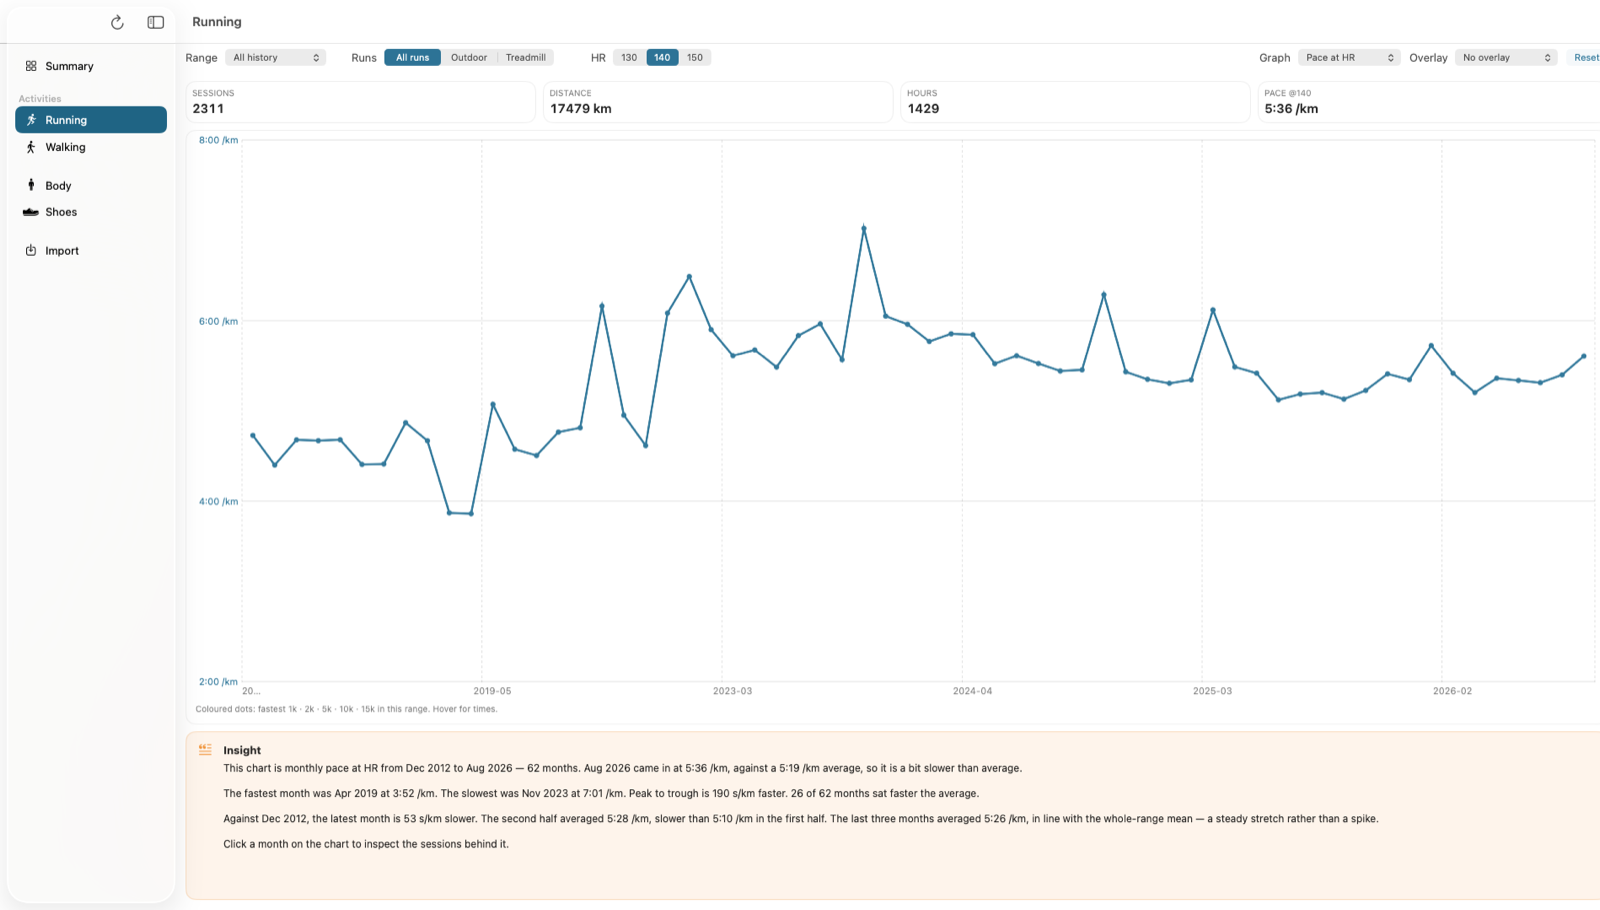
This is the screen I wanted for years, and the one the spreadsheet was really for.
Not race pace. Pace while the heart is at 140. Or 130, or 150. Same-ish effort, month after month, so I can see whether easy actually got easier or I just got better at kidding myself.
All history, HR 140. 5:36 per kilometre in the latest month. Faster months exist. Slower ones too. April 2019 is a spike I still do not fully believe. November 2023 is a trough I remember in my knees.
Strava will crown a 5K. It will not tell you whether your conversational pace is drifting while you congratulate yourself on volume. I know, because I have done both.
Body, next to the runs
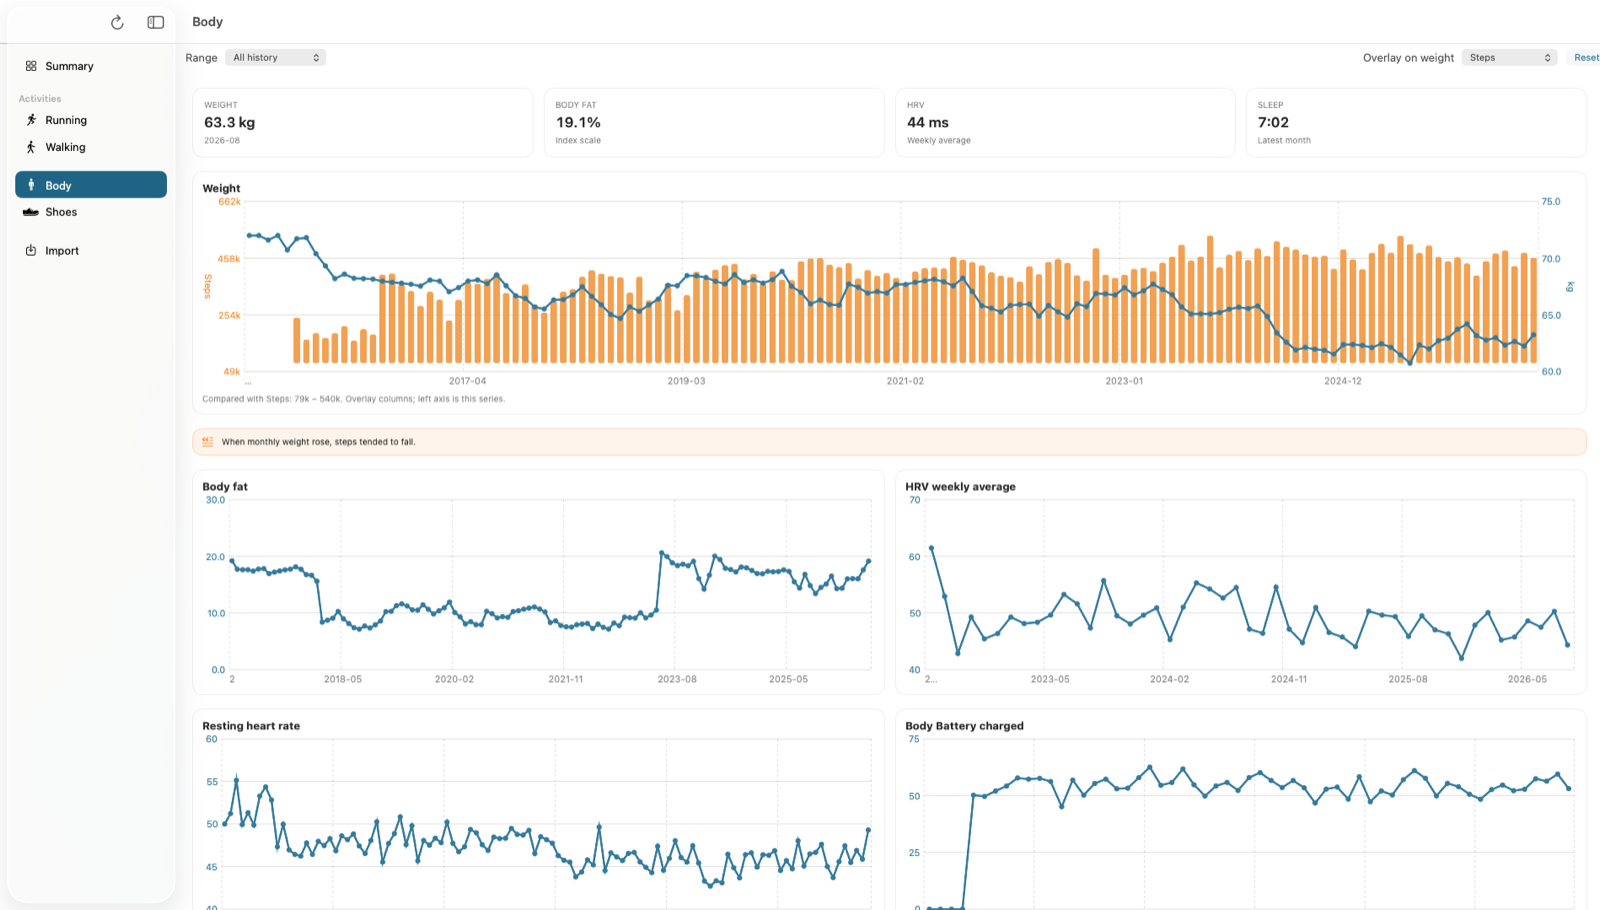
Weight, body fat, HRV, sleep along the top. Then weight as a line and steps as bars, because those two argue with each other and I would like to watch the argument rather than guess after Christmas.
The note on this one: when monthly weight rose, steps tended to fall. I did not need an app to suspect that. I did need one to put it on a line from 2017 instead of in a mood.
Underneath: body fat, HRV, resting heart rate, body battery. Same months. Click a month if you want to nosy. It is not a wellness product. It is the sensors I already paid for, in a layout I can read without a login maze.
Shoes
Garmin lets you assign a shoe. Then it mostly forgets you.
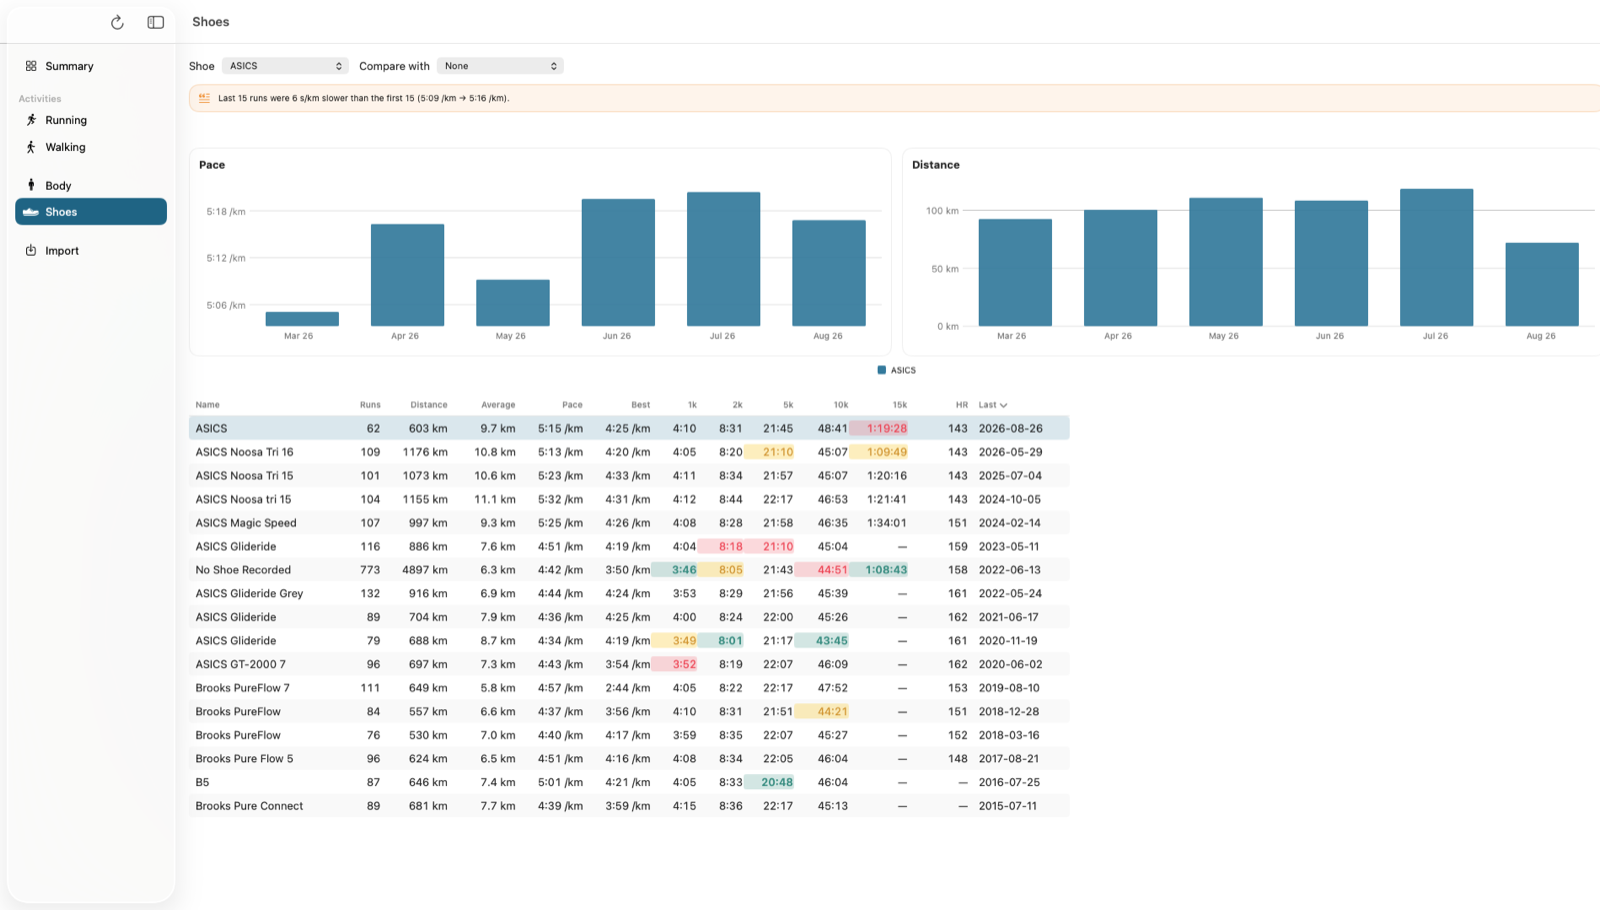
This screen does not, or at least it tries. Pick a pair. Compare it with another pair, or with everything else. Two charts: pace and distance by month. A table with runs, kilometres, average pace, best pace, heart rate, and the fastest 1k through 15k in that shoe.
The note on the pair I had open: the last 15 runs were six seconds per kilometre slower than the first 15. 5:09 down to 5:16. That might be the foam. It might be me. It might be both. It is at least a sentence, which is more than I used to get when a shoe quietly died on my feet.
There is a row for runs with no shoe recorded. Of course there is. I have been that person, repeatedly, and then tried to reconstruct it in a spreadsheet, which is a special kind of hobby.
Still making it
This is not a coaching plan. It will not make a 5K appear. It is a Mac window that reads the zip, catalogues the files, and writes a local database. Raw files are not copied or rewritten. Import is a folder picker. Walking has its own tab, which I needed because I walk a lot and pretend it is a subplot.
I have not put it on the App Store. I made solitaire and the drinks tracker the same way: for me, then left them here in case they were useful. This is messier. I change labels. I argue with charts. Some weeks it looks like a proper app and some weeks it looks like a spreadsheet that grew buttons, which is accurate.
If you only use Strava, some of this will look familiar. The missing piece for me was always the long view, plus one awkward metric: how fast I am when the heart is not showing off.
I still love the watches. I still open a spreadsheet when I should go to bed. The app is a work in progress. I am fine with that. I would rather a slightly unfinished screen I can actually read than a polished website that hides nineteen years behind five clicks.